

Here’s a wild one: 26 percent of Gen Z individuals treat sports betting as part of their investment strategy.
I’m not sure if that’s a sign of a market top or a sign of ennui. After crypto and AI stocks, maybe they need to bet the three-leg parlay just to feel normal.
Chart 1: Bruh
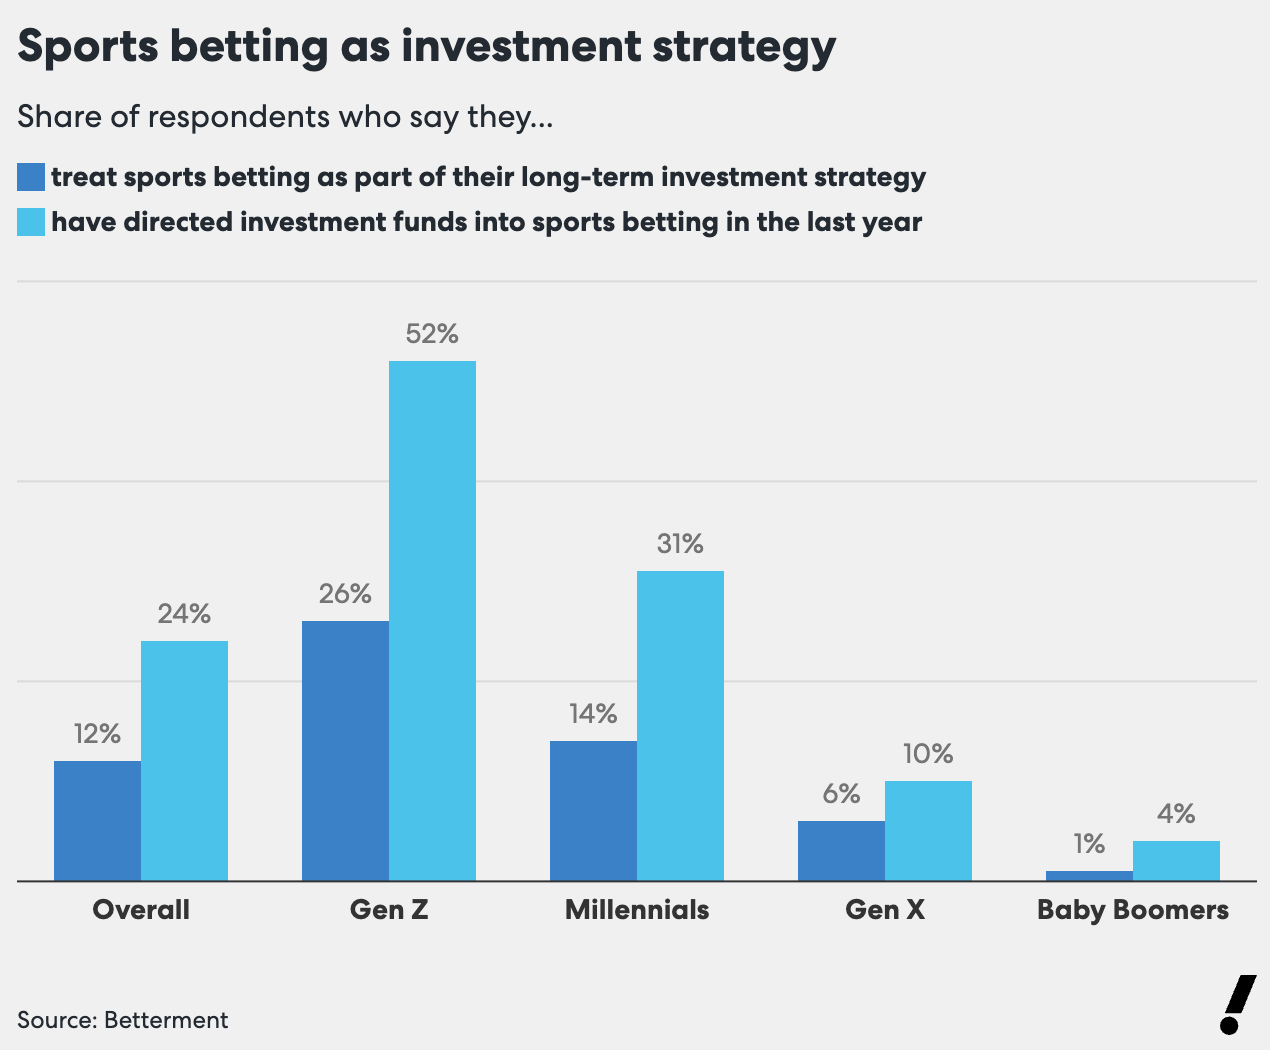
Don’t laugh Boomers, four percent of you degens are managing your “portfolio” from the shuffleboard courts.
Chart 2: Financial Conditions
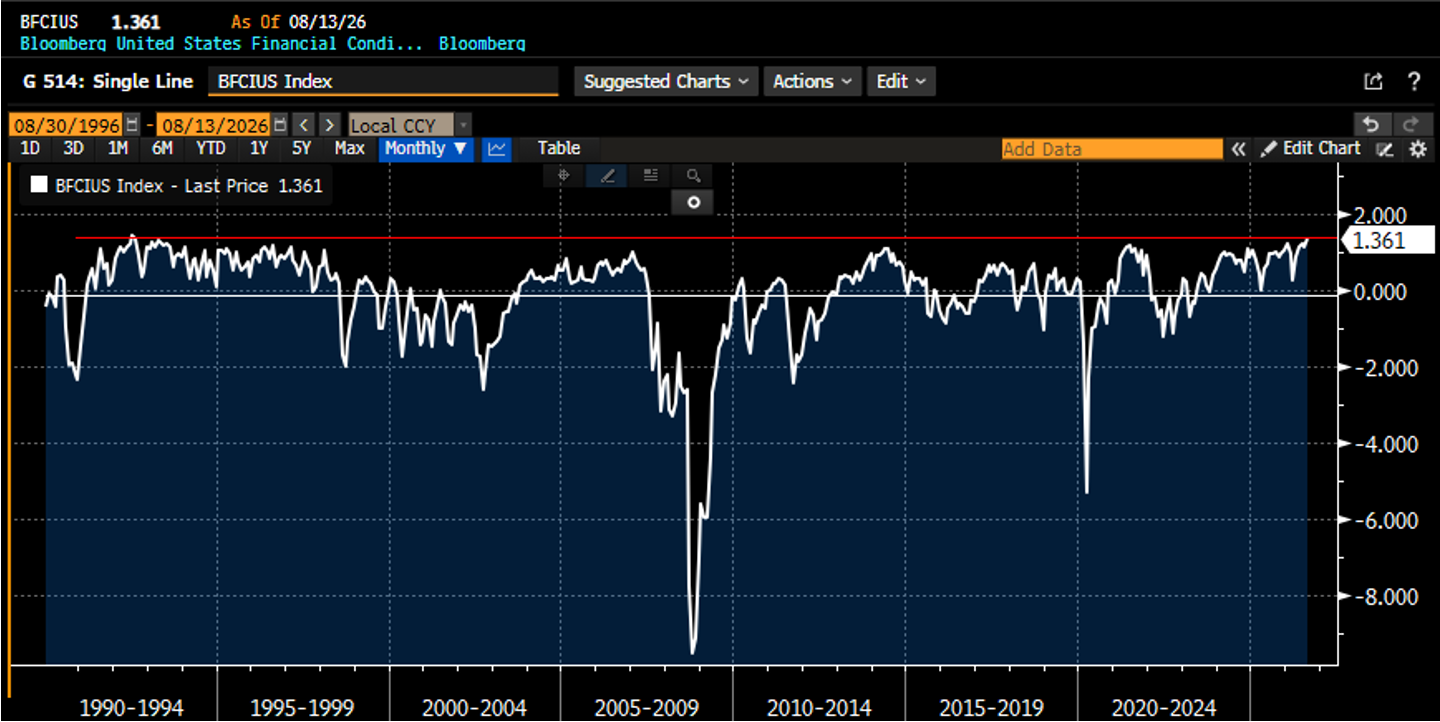
Chart 2, above, shows the Bloomberg Financial Conditions Index is the highest it’s been since about 1992 (red line).
Essentially, this gauge measures how easy it is to get financing for business ventures, and it’s now easier to get cash than it was during the Technology Bubble, the Global Financial Crisis, and in the immediate aftermath of COVID. That means money is as loose as a Walmart shopping cart wheel.
If you can work “AI” into a PowerPoint and keep a straight face, Wall Street will give you money like you’re Mr. White (go to 3:40 for the relevant part).
Chart 3: Margin Debit Balances in Retail Brokerage Accounts
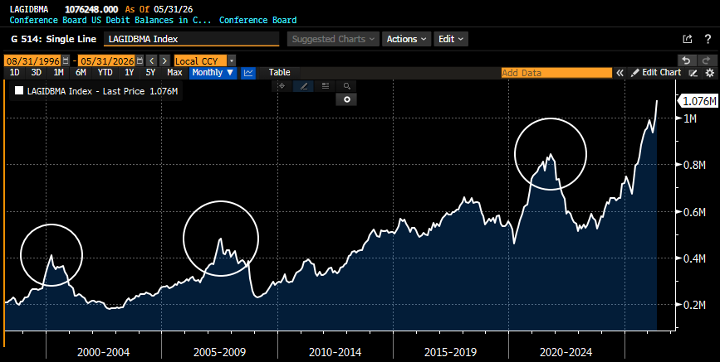
Chart 3, above, shows how the r/wallstreetbets crowd can take AI stocks up 10x in a few months… with other people’s money of course! Note that these mountains also have a right-hand side.
Chart 4: U.S. 10-Year Treasury Yield v. S&P 500 Index
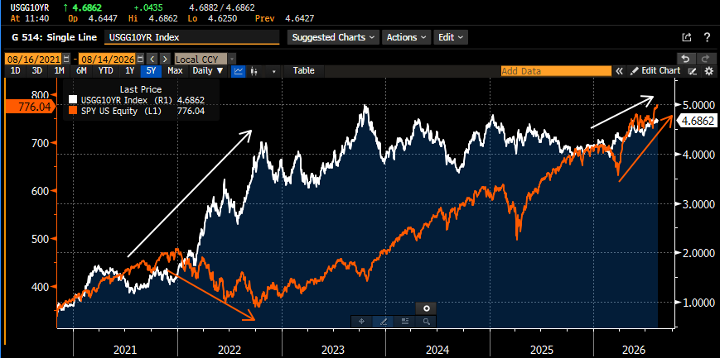
In Chart 4, above, you can see how, in 2022, interest rates went vertical (white line and arrows) and the S&P 500 Index declined by over 25 percent (orange line and arrows).
Now interest rates are rising again, but the S&P 500 Index is… rising faster? There is plenty of precedent for this: a hot economy takes rates and earnings up at the same time. The problem is that the stock market is pregnant with the rising yields, and when they get high enough, the rates burst out of the market’s chest and start drooling acid blood everywhere.
Too much?
Chart 5: Ground Control to Major Bomb
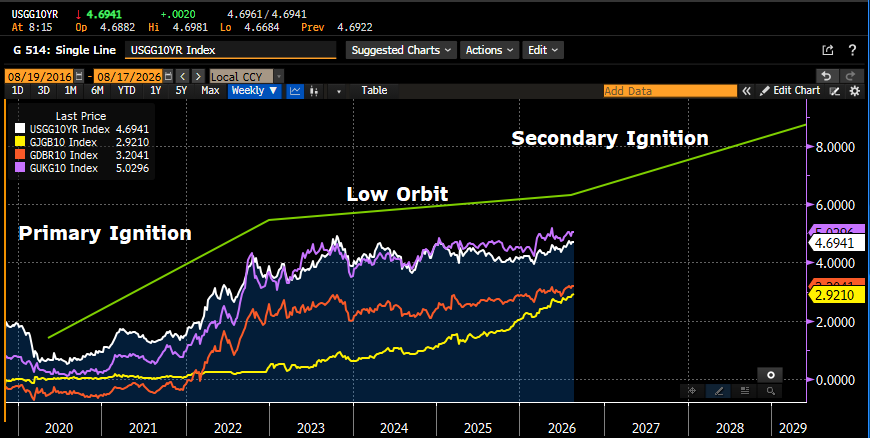
Chart 5, above, shows U.S., Japan, Germany, and UK yields (legend in chart). COVID provided the initial ignition, with global central banks printing + QE operations at an estimated $13-17 trillion. Rates rose during/after COVID, and once in orbit, they drifted higher for the past four years. Now the secondary ignition has begun.
Table 1: This Train Only Runs in One Direction
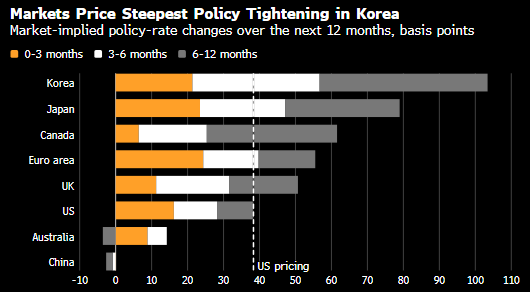
Table 1, above, is the Bloomberg estimate of interest rate hikes over the next 12 months. With the hyperscalers taking down over a $1.2 trillion, the competition for money is heating up.
Please understand that the bond market has gone psycho. It used to be a firefighter, but has turned into an arsonist. For the next 10-20 years, the bond market will be going around and starting asset fires.
Also, fun fact: the Iranians set the U.S. 10-year yield now. Attacks on ships and GCC infrastructure are actually attacks on U.S. bonds.
Chart 6: (Pokes with Stick) Make it Do Something
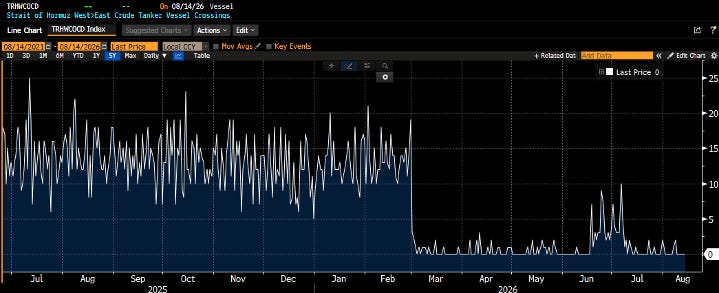
Ah yes, Chart 5, above shows the East-to-West oil tanker traffic in the Strait of Hormuz. What’s that? You’ve been reading about rogue tankers turning off their transponders to run the gauntlet? Yes, the Iranians are letting a handful of ships pass through unmolested each day, and half of them likely carry Iranian crude.
As I wrote about here (see Footnote 1), countries at war frequently continue to trade with each other for a variety of reasons. Letting a few ships through doesn’t change much and keeps the wells and refineries from having to shut-in.
(Pro Tip: don’t believe everything you read, or think, for that matter.)
I’m sure all these charts mean nothing… and please, make sure your advisor/broker has you fully invested in the S&P 500. /s